Ferdinando Pucci

and 1 more

HOW IS ACADEMIC RESEARCH EVALUATED? There are many different ways to determine the impact of scientific research. One of the oldest and best established measures is to look at the Impact Factor (IF) of the academic journal where the research has been published. The IF is simply the average number of citations to recent articles published in such an academic journal. The IF is important because the reputation of a journal is also used as a proxy to evaluate the relevance of past research performed by a scientist when s/he is applying to a new position or for funding. So, if you are a scientist who publishes in high-impact journals (the big names) you are more likely to get tenure or a research grant. Several criticisms have been made to the use and misuse of the IF. One of these is the policies that academic journal editors adopt to boost the IF of their journal (and get more ads), to the detriment of readers, writers and science at large. Unfortunately, these policies promote the publication of sensational claims by researchers who are in turn rewarded by funding agencies for publishing in high IF journals. This effect is broadly recognized by the scientific community and represents a conflict of interests, that in the long run increases public distrust in published data and slows down scientific discoveries. Scientific discoveries should instead foster new findings through the sharing of high quality scientific data, which feeds back into increasing the pace of scientific breakthroughs. It is apparent that the IF is a crucially deviated player in this situation. To resolve the conflict of interest, it is thus fundamental that funding agents (a major driving force in science) start complementing the IF with a better proxy for the relevance of publishing venues and, in turn, scientists’ work. RESEARCH IMPACT IN THE ERA OF FORKING. A number of alternative metrics for evaluating academic impact are emerging. These include metrics to give scholars credit for sharing of raw science (like datasets and code), semantic publishing, and social media contribution, based not solely on citation but also on usage, social bookmarking, conversations. We, at Authorea, strongly believe that these alternative metrics should and will be a fundamental ingredient of how scholars are evaluated for funding in the future. In fact, Authorea already welcomes data, code, and raw science materials alongside its articles, and is built on an infrastructure (Git) that naturally poses as a framework for distributing, versioning, and tracking those materials. Git is a versioning control platform currently employed by developers for collaborating on source code, and its features perfectly fit the needs of most scientists as well. A versioning system, such as Authorea and GitHub, empowers FORKING of peer-reviewed research data, allowing a colleague of yours to further develop it in a new direction. Forking inherits the history of the work and preserves the value chain of science (i.e., who did what). In other words, forking in science means _standing on the shoulder of giants_ (or soon to be giants) and is equivalent to citing someone else’s work but in a functional manner. Whether it is a “negative” result (we like to call it non-confirmatory result) or not, publishing your peer reviewed research in Authorea will promote forking of your data. (To learn how we plan to implement peer review in the system, please stay tuned for future posts on this blog.) MORE FORKING, MORE IMPACT, HIGHER QUALITY SCIENCE. Obviously, the more of your research data are published, the higher are your chances that they will be forked and used as a basis for groundbreaking work, and in turn, the higher the interest in your work and your academic impact. Whether your projects are data-driven peer reviewed articles on Authorea discussing a new finding, raw datasets detailing some novel findings on Zenodo or Figshare, source code repositories hosted on Github presenting a new statistical package, every bit of your work that can be reused, will be forked and will give you credit. Do you want to do a favor to science? Publish also non-confirmatory results and help your scientific community to quickly spot bad science by publishing a dead end fork (Figure 1).

Alberto Pepe

and 4 more

We're in a crisis  We are in the midst of an unprecedented global crisis. Just weeks since its outbreak, the Coronavirus pandemic (COVID-19) has already affected, and will continue to affect, our daily lives, around the globe, for the foreseeable future. The answers and the solutions to this crisis will come from science. But the crisis affects science, too.It affects students, educators, and researchers; not just their day-to-day lives, social ties, and work routines, but also their ability to actively collaborate, convene in face-to-face meetings, attend academic conferences, teach and learn in an open university setting, pay a visit to the library, work overnight at the laboratory, and so on.But the thing is: science cannot stop. Scientific progress must go on. For each one of the challenges that scientists face in this time of crisis, there is, or there will be, a solution. We believe that the solution is not to be found in a single technological tool, product, framework, institution, funding agency, or company. It is the global cyber-infrastructure of scientific collaboration, built on scientific rigor, intellectual curiosity, and cooperation, that will enable science to advance in such difficult times. The power of scientific collaborationAs scientists, publishers, science communicators and technologists, we believe that: a. Science is the solution to the ongoing crisis. Now more than ever, reliance on the scientific method, rigor and clarity of scientific communication, transparency, reproducibility, and seamless sharing of all research data (including negative results), are fundamental to solving this health crisis and advancing human progress.b. Global collaboration and cooperation, beyond and above national and economic interests, is necessary not only at the scientific level, but also at the political and societal level. We're more interconnected and interdependent today than ever. And such interconnectedness extends to the ecological ecosystem in which we live. A crisis of such scale requires global solidarity, bipartisan political action, civic participation, and long-term thinking.

Alyssa Goodman

and 10 more

ABSTRACT The very long, thin infrared dark cloud Nessie is even longer than had been previously claimed, and an analysis of its Galactic location suggests that it lies directly in the Milky Way’s mid-plane, tracing out a highly elongated bone-like feature within the prominent Scutum-Centaurus spiral arm. Re-analysis of mid-infrared imagery from the Spitzer Space Telescope shows that this IRDC is at least 2, and possibly as many as 8 times longer than had originally been claimed by Nessie’s discoverers, ; its aspect ratio is therefore at least 150:1, and possibly as large as 800:1. A careful accounting for both the Sun’s offset from the Galactic plane (∼25 pc) and the Galactic center’s offset from the (lII, bII)=(0, 0) position defined by the IAU in 1959 shows that the latitude of the true Galactic mid-plane at the 3.1 kpc distance to the Scutum-Centaurus Arm is not b = 0, but instead closer to b = −0.5, which is the latitude of Nessie to within a few pc. Apparently, Nessie lies _in_ the Galactic mid-plane. An analysis of the radial velocities of low-density (CO) and high-density (${\rm NH}_3$) gas associated with the Nessie dust feature suggests that Nessie runs along the Scutum-Centaurus Arm in position-position-velocity space, which means it likely forms a dense ‘spine’ of the arm in real space as well. No galaxy-scale simulation to date has the spatial resolution to predict a Nessie-like feature, but extant simulations do suggest that highly elongated over-dense filaments should be associated with a galaxy’s spiral arms. Nessie is situated in the closest major spiral arm to the Sun toward the inner Galaxy, and appears almost perpendicular to our line of sight, making it the easiest feature of its kind to detect from our location (a shadow of an Arm’s bone, illuminated by the Galaxy beyond). Although the Sun’s (∼25 pc) offset from the Galactic plane is not large in comparison with the half-thickness of the plane as traced by Population I objects such as GMCs and HII regions (∼200 pc; ), it may be significant compared with an extremely thin layer that might be traced out by Nessie-like “bones” of the Milky Way. Future high-resolution extinction and molecular line data may therefore allow us to exploit the Sun’s position above the plane to gain a (very foreshortened) view “from above" of dense gas in Milky Way’s disk and its structure.

Authorea Help

and 3 more

WHAT IS LATEX? LaTeX is a programming language that can be used for writing and typesetting documents. It is especially useful to write mathematical notation such as equations and formulae. HOW TO USE LATEX TO WRITE MATHEMATICAL NOTATION There are three ways to enter “math mode” and present a mathematical expression in LaTeX: 1. _inline_ (in the middle of a text line) 2. as an _equation_, on a separate dedicated line 3. as a full-sized inline expression (_displaystyle_) _inline_ Inline expressions occur in the middle of a sentence. To produce an inline expression, place the math expression between dollar signs ($). For example, typing $E=mc^2$ yields E = mc². _equation_ Equations are mathematical expressions that are given their own line and are centered on the page. These are usually used for important equations that deserve to be showcased on their own line or for large equations that cannot fit inline. To produce an inline expression, place the mathematical expression between the symbols \[! and \verb!\]. Typing \[x=}{2a}\] yields \[x=}{2a}\] _displaystyle_ To get full-sized inline mathematical expressions use \displaystyle. Typing I want this $\displaystyle ^{\infty} {n}$, not this $^{\infty} {n}$. yields: I want this $\displaystyle ^{\infty}{n}$, not this $^{\infty}{n}.$ SYMBOLS (IN _MATH_ MODE) The basics As discussed above math mode in LaTeX happens inside the dollar signs ($...$), inside the square brackets \[...\] and inside equation and displaystyle environments. Here’s a cheatsheet showing what is possible in a math environment: -------------------------- ----------------- --------------- _description_ _command_ _output_ addition + + subtraction - − plus or minus \pm ± multiplication (times) \times × multiplication (dot) \cdot ⋅ division symbol \div ÷ division (slash) / / simple text text infinity \infty ∞ dots 1,2,3,\ldots 1, 2, 3, … dots 1+2+3+\cdots 1 + 2 + 3 + ⋯ fraction {b} ${b}$ square root $$ nth root \sqrt[n]{x} $\sqrt[n]{x}$ exponentiation a^b ab subscript a_b ab absolute value |x| |x| natural log \ln(x) ln(x) logarithms b logab exponential function e^x=\exp(x) ex = exp(x) deg \deg(f) deg(f) degree \degree $\degree$ arcmin ^\prime ′ arcsec ^{\prime\prime} ′′ circle plus \oplus ⊕ circle times \otimes ⊗ equal = = not equal \ne ≠ less than < < less than or equal to \le ≤ greater than or equal to \ge ≥ approximately equal to \approx ≈ -------------------------- ----------------- ---------------

Alyssa Goodman

and 10 more

Alberto Pepe

and 1 more

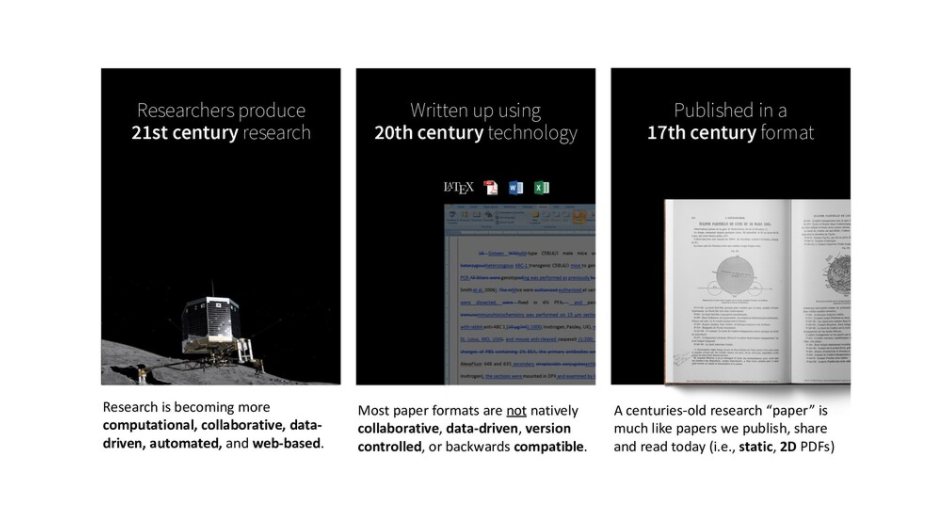
Why are scientific ideas disseminated via "papers"? Is a paper the best way to share and publish research results today? The format and function of research communication has not changed much in the last 400 years. Take any paper published this week, download it, and compare it to a digitized version of a paper from the 1600s. The two papers may differ in page layout, color, and typeface, but they are essentially identical in format - a collection of text and figures. Indeed, the fact that we refer to the mainstream outlet of research communication as "paper" speaks volume of its boundness to print.While the published format has not changed in the last 400 years, the change in published content is astronomical: a proclamation of the success of science. The discovery of molecular structure of DNA \cite{WATSON_1953}, penicillin \cite{Fleming1980}, and the formulation of general relativity \cite{Einstein_1916} are some of the biggest and most splendid scientific discoveries of all time. They were all published in a two-dimensional paper format. Even more recently, the groundbreaking discovery of gravitational waves, which earned the 2017 Nobel Prize in Physics to the leads of the LIGO collaboration, was published with a traditional paper format \cite{Abbott_2016}. LIGO's groundbreaking was certainly not analyzed on a 2D piece of paper.So, how is it possible that scientists produce and write cutting-edge "21st-century research" and still publish it in a "17th-century format"? \cite{obsolete,Pepe}Obviously, the paper format, being so enduring and persistent, has served science well. But things have changed in the last three decades. The recent explosion of content digitalization, growing internet speed and connectivity, and reliance on data, code, and computational power are leading to an unprecedented and irreversible path to changing the way we publish and disseminate research ideas. A Gutenberg-style revolution in scholarly communication is upon us, and we believe it is being pioneered by the Open Science movement. The Open Science initiative aims to make scientific research and its dissemination accessible, reproducible, and transparent. In addition to encouraging publication of research as Open Access as early as possible (the availability of preprints in subject-based repositories has moved beyond  the realm of physics), for many computational domains Open Science translates into making code and data available to everyone, and into practicing "open notebook" science. In other words: readers and reviewers must be able to understand how the authors produced the computational results, which parameters were used for the analysis, and how manipulations to these parameters affect the results. Increasingly, journals and funding agencies are mandating that researchers share their code and data when reporting on computational results based on code and data. However, even when data and code are provided by authors, and published, they are oftentimes relegated to Supplementary Information or to entirely separate platforms, disconnected from the published "full text". Since code, data, and text are not linked on a deep level, readers and reviewers are faced with barriers that hinder their ability to understand and retrace how the authors achieved a specific result. In addition, while data and code may be available in repositories external to the corresponding article \cite{Antoniol_2002}, it takes readers and reviewers considerable effort to verify the software and re-run analyses with, say, changed parameters.The idea of a multimedia, multi-dimensional, scholarly publication that defies the limitations of the 2-dimensional paper format  is not new. The publication history of the first detection of gravitational waves by the LIGO collaboration is an example of how much this is needed in scientific publishing. The discovery was reported in a series of traditional articles \cite{Abbott_2016}\cite{Abbott_2016a} but with an associated and externally hosted supplemental Jupyter notebook \cite{losc-tutoriallosc_event_tutorialmaster}. The notebook allows readers to run and tweak the code, change parameters to alter the analysis, and, in its section dedicated to the signal processing of the gravitational waves into sound, it even allows readers to play the bloop of two black holes colliding. Yet, the notebook and the multimedia elements had to reside outside the article. Why?

Alberto Pepe

and 1 more

Hello, and welcome to Authorea!👋  We're happy to have you join us on this journey towards making writing and publishing smoother, data-driven, interactive, open, and simply awesome. This document is a short guide on how to get started with Authorea, specifically how to take advantage of some of our powerful tools. Of course, feedback and questions are not only welcome, but encouraged--just hit the comment icon to the right of this text 💬  (You can also highlight specific parts of the text to leave a comment on). (Ha. That's your first lesson!).The BasicsAuthorea is a collaborative document editor built primarily for researchers. It allows you to collaboratively write in real-time in normal text, LaTeX, and Markdown all within the same document. In addition to easily writing together, each article on Authorea is a git repository, which allows you to host data, interactive figures, and code. But first, let's get started! 1. Sign up.If you're not already signed up, do so at authorea.com/signup.  Tip: if you are part of an organization, sign up with your organizational email.  2. First stepsDuring the signup process you will be asked a few questions: your location, your title, etc. You will be also prompted to join a group. Groups are awesome! They allow you to become part of a shared document workspace. Tip: during signup, join a group or create a new one for your team. Overall, we suggest you fill out your profile information to get the best possible Authorea experience and to see if any of your friends are already on the platform. If you don't do it initially during sign up, don't worry; you can always edit your user information in your settings later on.Once you've landed on your profile page (see below). There are a few things you should immediately do:Add a profile picture. You've got a great face, show it to the world :) For reference, please see Pete, our chief dog officer (CDO), below. Add personal and group information. If you haven't added any personal information, like a bio, a group affiliation, or your location, do it! You might find some people at your organization already part of Authorea, plus it is a great way to build your online footprint, which is always good for getting jobs.Invite your colleagues. Click here to invite contacts from your Gmail. You'll get extra private documents in your account and you'll make Pete very happy!